GUI
The Essentials
We recommend you first read our Algorithm description before reading about the GUI.
A graphical user interface (GUI) is a graphical way for users to interact with electronics. Our GUI allows the user to interact with the prosthetic and algorithm to understand. Written in MATLAB, it communicates with the Arduino and the algorithm through serial communication, and displays the current sensor data in three dimensions, the data gathered during calibration and the statistical distribution (ellipsoid) associated with classification of each motion. In addition, the GUI runs the same algorithm that is run on the prosthetic, indicating which points are read as peaks, which motion the hand would register, and providing feedback to the user.
The GUI has already seen use in our tests and development process and its applications are far reaching: It can be used in both a lab setting and for physical therapy applications. In a lab the GUI can be used to test sensor placement and determine recommended user muscle movements. The data output to MATLAB is particularly useful as it can be analyzed further with stronger algorithms. In physical therapy, the GUI can be used as a training tool to prepare for use of our prosthetic. It can help to visualize how many distinguishable inputs the user can provide and thus how many motions the prosthetic will be able to perform, as well as to develop more of these inputs through interactive games.
We have also designed the GUI to run as a standalone application so it can be used on computers without MATLAB, making it accessible to anyone. Those with MATLAB licenses can run the GUI natively, those without can use the freely available MATLAB Runtime Environment.
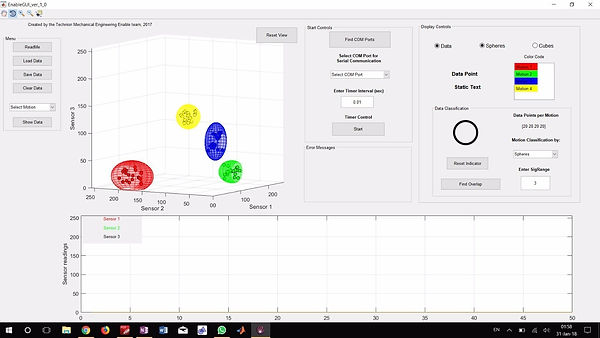
Visual representation of the algorithm from the GUI. Note the three dimensional space and the ellipsoids corresponding to four different motions
The Details (for Developers)
Conn
The GUI connects to the Arduino through COM ports, the same as when connecting an Arduino normally for serial communication through the Arduino IDE. A drop down menu populates with available COM ports and you need to select the proper port. (Usually there is only one, if this isn't the case, use the Arduino IDE to determine which COM port is the proper one.)
The GUI's code runs in a loop, much like the algorithm itself. As such, the timing between the two needs to be syncronized. We tested it on a few computers and set the default speed of the GUI to correspond with the speed of the algorithm.
Communication between the Arduino and the GUI is robust. The GUI receives information from the Arduino including the current data point, classification of motions, and information about peaks. During calibration it receives all of the data sets, which can be then saved and analyzed further, or used to show progress. During runtime, the GUI runs its own version of the algorithm, which is the same algorithm, just implemented through MATLAB. The GUI allows for classification by hypercubes (right rectangular prisms) whose construction is very similar to that of the ellipsoids.
We recommend using the GUI on its own with the EMG sensors before attempting to fit or build a prosthetic. Using the GUI the user can get a feel for how many muscle movements can be made consistently, and thus how many motions they can make with the prosthetic. The GUI also serves as an aid for calibration of the individual EMG sensors, and achieving ideal placement location. Even as the user continues to use the prosthetic, the GUI can be used periodically to check the feasibility of adding.
The GUI has two main axes; axis 1 (top left), and axis 2 (bottom). Axis 1 shows calibration data points and the hyper-objects. The blue pointer line indicates where the current reading lies in the three-dimensional space. Axis 2 shows the current sensor readings. In the right hand panel there is an indicator that changes color to show which was the last motion that an incoming reading was classified as.
Implementing the GUI with more sensors is problematic as this increases the number of dimensions required to visualize the algorithm. This is complicated in more than three dimensions. Realistically, there is no need for more sensors, and we have found that there is not much more information gained by adding more sensors as they just tend to pick up on the same muscle activation.
The GUI is built to be relatively user friendly. We tried to anticipate common user actions that could disable the GUI (such as disconnecting the Arduino) and alert the user to errors.
The GUI is capable of identifying when motions overlap. This is a user initiated action and works by running on the z axis. At each level, the ellipsoids are ellipses. Each possible combination of 2D ellipses is checked to determine if there is intersection. Intersection at one or more of these slices indicates an intersection of the ellipsoids in 3D space. As explained on the Algorithm page, if a peak falls within more than one ellipsoid, it is classified as belonging to the ellipsoid to whose center it is closer. So having overlapping ellipsoids does not prevent the algorithm from working, but too much overlap is definitely not a good thing. Ideally the motions should be spread as far from each other as possible throughout the available volume.

Visual representation of how the GUI checks for overlap between the ellipsoids
Files
Programs you will need to run, view or edit the GUI files.
-
MATLAB 2017b and later
-
or MATLAB Runtime 2017b, available here for free
To edit the dimensioning code you will need a MATLAB license. The GUI can be run as a standalone application with just the Runtime environment)
What We're Working On
-
Implementing learning and teaching methods to help suggest and train new motions through the use of games or practice sessions.
-
Creating a GUI that will allow display of our next algorithm (spherical coordinates)